Breslau Demographics
Breslau Demographics
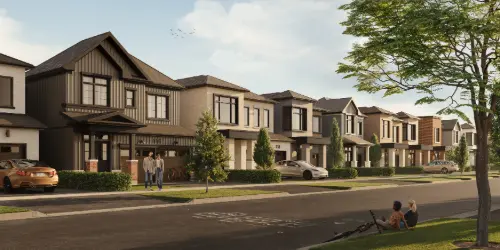
Breslau Ontario, is a charming and rapidly growing community in the Township of Woolwich and nestled between Kitchener and Guelph, offering a perfect blend of small-town appeal and convenient access to urban amenities. Known for its family-friendly atmosphere, scenic surroundings, and strong sense of community, Breslau has become an increasingly attractive destination for homebuyers. The real estate market in Breslau has seen steady growth in recent years, driven by its strategic location and the expanding Waterloo Region. New housing developments and modern subdivisions are complementing the area’s historic homes, providing a diverse mix of options for buyers. With rising demand, property values have appreciated, making Breslau a compelling location for both homeowners and investors seeking a balance of tranquility and long-term growth potential.
HOUSING
Woolwich Number of Owners and Renters
| Owners and Renters | Total |
|---|---|
| Owner | 7,855 |
| Renter | 1,505 |
Woolwich Dwelling Types
| Dwelling Type | Total |
|---|---|
| Single-detached house | 7,095 |
| Semi-detached house | 765 |
| Row house | 535 |
| Condominium | 380 |
Woolwich Age of Homeowners
| Age of Homeowners | Total |
|---|---|
| 15 to 24 years | 60 |
| 25 to 34 years | 1,230 |
| 35 to 44 years | 1,800 |
| 45 to 54 years | 1,855 |
| 55 to 64 years | 1,760 |
| 65 to 74 years | 1,430 |
| 75 to 84 years | 905 |
| 85 years and over | 310 |
POPULATION
Woolwich Population Comparison
| Year | Total |
|---|---|
| 2016 | 25,006 |
| 2021 | 26,999 |
Woolwich Population by Age
| Age | Total |
|---|---|
| 0 to 4 years | 1,790 |
| 5 to 9 years | 1,870 |
| 10 to 14 years | 1,950 |
| 15 to 19 years | 1,735 |
| 20 to 24 years | 1,435 |
| 25 to 29 years | 1,350 |
| 30 to 34 years | 1,705 |
| 35 to 39 years | 1,865 |
| 40 to 44 years | 1,820 |
| 45 to 49 years | 1,720 |
| 50 to 54 years | 1,675 |
| 55 to 59 years | 1,755 |
| 60 to 64 years | 1,585 |
| 65 to 69 years | 1,395 |
| 70 to 74 years | 1,180 |
| 75 to 79 years | 965 |
| 80 to 84 years | 590 |
| 85 to 89 years | 375 |
| 90 to 94 years | 180 |
| 95 to 99 years | 55 |
| 100 years and over | 5 |
INCOME
Woolwich Median After-tax Income of Household
| Median After-tax Income of Household |
|---|
| 99,000 |
Woolwich Household After-tax Income Groups
| Income Groups | Number of People |
|---|---|
| Under $5,000 | 60 |
| $5,000 to $9,999 | 25 |
| $10,000 to $14,999 | 65 |
| $15,000 to $19,999 | 95 |
| $20,000 to $24,999 | 205 |
| $25,000 to $29,999 | 230 |
| $30,000 to $34,999 | 215 |
| $35,000 to $39,999 | 270 |
| $40,000 to $44,999 | 275 |
| $45,000 to $49,999 | 270 |
| $50,000 to $59,999 | 565 |
| $60,000 to $69,999 | 595 |
| $70,000 to $79,999 | 610 |
| $80,000 to $89,999 | 630 |
| $90,000 to $99,999 | 660 |
| $100,000 and over | 4,600 |
| $100,000 to $124,999 | 1,465 |
| $125,000 to $149,999 | 1,120 |
| $150,000 and over | 2,010 |
ETHNIC OR CULTURAL ORIGIN
Woolwich Ethnic or Cultural Origin Top 10
| Ethnic or Cultural Orgin | Total |
|---|---|
| Canadian | 4,055 |
| English | 5,550 |
| Irish | 4,385 |
| Scottish | 4,730 |
| French, n.o.s.122 | 2,015 |
| German | 8,100 |
| Chinese | 265 |
| Italian | 750 |
| Indian (India) | 540 |
| Ukrainian | 630 |
| Dutch | 1,375 |
| Polish | 1,110 |
| Québécois | 10 |
| British Isles, n.o.s.123 | 1,185 |
| Filipino | 210 |
| French Canadian | 185 |
| Caucasian (White), n.o.s.124 | 445 |
| First Nations (North American Indian), n.o.s.125 | 120 |
| Métis | 125 |
| European, n.o.s.126 | 550 |
| Russian | 325 |
| Norwegian | 70 |
| Welsh | 425 |
| Portuguese | 295 |
| American | 375 |
| Spanish | 155 |
| Swedish | 130 |
| Hungarian | 370 |
| Acadian | 80 |
| Pakistani | 105 |
| African, n.o.s.127 | 95 |
| Jewish | 85 |
| Punjabi | 80 |
| Vietnamese | 175 |
| Arab, n.o.s.128 | 50 |
| Greek | 165 |
| Jamaican | 85 |
| Asian, n.o.s.129 | 55 |
| Cree, n.o.s.130 | 30 |
| Korean | 50 |
| Romanian | 515 |
| Lebanese | 35 |
| Iranian | 0 |
| Christian, n.i.e.131 | 330 |
| Danish | 160 |
| North American Indigenous, n.o.s.132 | 70 |
| Sikh | 65 |
| Austrian | 180 |
| Belgian | 110 |
| Haitian | 0 |
| Hindu | 80 |
| Mexican | 250 |
| Mennonite | 1,690 |
| Swiss | 2,195 |
| Finnish | 80 |
| Sri Lankan | 25 |
| Croatian | 175 |
| Japanese | 40 |
| South Asian, n.o.s.133 | 40 |
| Mi'kmaq, n.o.s.134 | 0 |
| Northern European, n.o.s.135 | 50 |
| Muslim | 0 |
| Egyptian | 0 |
| Latin, Central or South American, n.o.s.136 | 20 |
| Tamil | 0 |
| Icelandic | 25 |
| Colombian | 45 |
| Moroccan | 0 |
| Czech | 85 |
| Syrian | 0 |
| Guyanese | 30 |
| Afghan | 20 |
| Black, n.o.s.137 | 25 |
| Serbian | 200 |
| Ojibway | 0 |
| Newfoundlander | 90 |
| Hong Konger | 30 |
| Ontarian | 185 |
| Persian | 0 |
| Trinidadian/Tobagonian | 25 |
| Turkish | 50 |
| Inuit, n.o.s.138 | 15 |
| Bangladeshi | 15 |
| Algerian | 0 |
| Brazilian | 30 |
| Nigerian | 10 |
| Armenian | 35 |
| Slovak | 65 |
| Eastern European, n.o.s.139 | 70 |
| Somali | 0 |
| Taiwanese | 20 |
| Iraqi | 0 |
| Salvadorean | 30 |
| African Caribbean | 0 |
| East or Southeast Asian, n.o.s.140 | 0 |
| West or Central Asian or Middle Eastern, n.o.s.141 | 25 |
| Caribbean, n.o.s.142 | 40 |
| Algonquin | 0 |
| West Indian, n.o.s.143 | 10 |
| Lithuanian | 30 |
| South African | 25 |
| Australian | 10 |
| Palestinian | 20 |
| Chilean | 30 |
| Congolese | 0 |
| Nova Scotian | 10 |
| Ethiopian | 30 |
| Hispanic, n.o.s.144 | 40 |
| Peruvian | 0 |
| Yoruba | 0 |
| Cambodian (Khmer) | 15 |
| Berber | 0 |
| Albanian | 20 |
| Maltese | 45 |
| Macedonian | 40 |
| Slovenian | 70 |
| Western European, n.o.s.145 | 0 |
| New Brunswicker | 20 |
| Gujarati | 0 |
| Eritrean | 0 |
| African Canadian | 0 |
| Israeli | 0 |
| Mohawk | 20 |
| Czechoslovakian, n.o.s.146 | 45 |
| Bulgarian | 15 |
| Albertan | 0 |
| Ghanaian | 0 |
| Barbadian | 0 |
| African American | 15 |
| Yugoslavian, n.o.s.147 | 85 |
| Tunisian | 0 |
| Slavic, n.o.s.148 | 0 |
| Cuban | 0 |
| Bosnian | 25 |
| Venezuelan | 10 |
| Innu/Montagnais, n.o.s.149 | 0 |
| Latvian | 50 |
| Bengali | 25 |
| Cameroonian | 0 |
| Guatemalan | 0 |
| Indonesian | 0 |
| Laotian | 125 |
| Ilocano | 0 |
| Northern Irish | 35 |
| Celtic, n.o.s.150 | 50 |
| British Columbian | 0 |
| Ecuadorian | 0 |
| Franco Ontarian | 0 |
| Argentinian | 0 |
| Estonian | 0 |
| Kurdish | 10 |
| Fijian | 0 |
| Jatt | 0 |
| North American, n.o.s.151 | 15 |
| Coptic | 0 |
| Thai | 25 |
| Dominican | 0 |
| Nepali | 0 |
| Kabyle | 0 |
| Assyrian | 0 |
| Igbo | 0 |
| Byelorussian | 0 |
| Dene, n.o.s.152 | 0 |
| Blackfoot, n.o.s.153 | 0 |
| Abenaki | 0 |
| Moldovan | 10 |
| Iroquois (Haudenosaunee), n.o.s.154 | 0 |
| New Zealander | 35 |
| Sudanese | 0 |
| Breton | 0 |
| Pennsylvania Dutch | 265 |
| Malaysian | 0 |
| Plains Cree | 0 |
| North African, n.o.s.155 | 0 |
| Huron (Wendat) | 0 |
| Saskatchewanian | 0 |
| Buddhist | 0 |
| Gaspesian | 0 |
| Norman | 15 |
| Southern or East African, n.o.s.156 | 0 |
| Ivorian | 0 |
| Saulteaux | 0 |
| Anishinaabe, n.o.s.157 | 0 |
| Burundian | 0 |
| Tigrinya | 0 |
| Nicaraguan | 30 |
| Mauritian | 0 |
| Kenyan | 0 |
| Oji-Cree | 0 |
| Vincentian | 0 |
| Jordanian | 0 |
| Manitoban | 0 |
| Cape Bretoner | 0 |
| Rwandan | 0 |
| Grenadian | 0 |
| Malayali | 0 |
| Chaldean | 0 |
| Sinhalese | 0 |
| Mayan | 0 |
| Honduran | 0 |
| Cherokee | 0 |
| Qalipu Mi'kmaq | 0 |
| Indo-Caribbean | 0 |
| Flemish | 0 |
| United Empire Loyalist | 0 |
| Senegalese | 0 |
| Azerbaijani | 0 |
| Sicilian | 0 |
| Pashtun | 0 |
| Malay | 0 |
| Goan | 0 |
| Bantu, n.o.s.158 | 0 |
| Tibetan | 0 |
| Zimbabwean | 0 |
| Burmese | 0 |
| Mongolian | 0 |
| Azorean | 0 |
| Atikamekw | 0 |
| Bamileke | 0 |
| Indo-Guyanese | 0 |
| Ugandan | 0 |
| Oromo | 0 |
| Tanzanian | 0 |
| Yemeni | 0 |
| Central African | 0 |
| Libyan | 0 |
| Basque | 0 |
| Uruguayan | 0 |
| Akan, n.o.s.159 | 0 |
| Central or West African, n.o.s.160 | 0 |
| Igorot | 0 |
| Fulani | 0 |
| Woodland Cree | 0 |
| Guinean | 0 |
| St. Lucian | 0 |
| Prince Edward Islander | 10 |
| Maliseet | 0 |
| Beninese | 0 |
| Telugu | 15 |
| Roma | 0 |
| Costa Rican | 0 |
| African Nova Scotian | 0 |
| Malagasy | 0 |
| Kashmiri | 0 |
| Singaporean | 0 |
| Karen | 0 |
| Edo | 0 |
| Tajik | 0 |
| Amhara | 0 |
| Paraguayan | 15 |
EMPLOYMENT
Woolwich Employment
| Employment | Total |
|---|---|
| Employed | 13,700 |
| Unemployed | 900 |
Woolwich Employment by Industry
| Industries | Number Employed |
|---|---|
| Agriculture, forestry, fishing and hunting | 900 |
| Mining, quarrying, and oil and gas extraction | 10 |
| Utilities | 85 |
| Construction | 1,455 |
| Manufacturing | 1,845 |
| Wholesale trade | 580 |
| Retail trade | 1,410 |
| Transportation and warehousing | 475 |
| Information and cultural industries | 225 |
| Finance and insurance | 915 |
| Real estate and rental and leasing | 220 |
| Professional, scientific and technical services | 1,035 |
| Management of companies and enterprises | 65 |
| Administrative and support, waste management and remediation services | 420 |
| Educational services | 1,015 |
| Health care and social assistance | 1,445 |
| Arts, entertainment and recreation | 115 |
| Accommodation and food services | 415 |
| Other services (except public administration) | 565 |
| Public administration | 500 |
EDUCATION
Woolwich Postsecondary Education
| Employment | Total |
|---|---|
| Employed | 13,700 |
| Unemployed | 900 |
Source: Statistics Canada. 2021 Census of Population.
https://www12.statcan.gc.ca/census-recensement/index-eng.cfm?
READY TO BOOK
416-768-4576
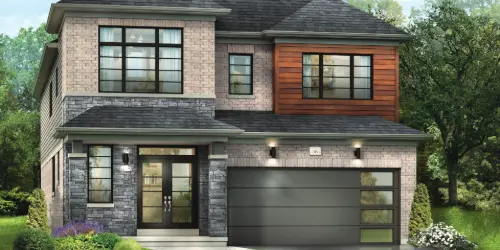
New Detached Homes in Breslau
New Townhomes in Breslau
